Enterprise / Dashboard
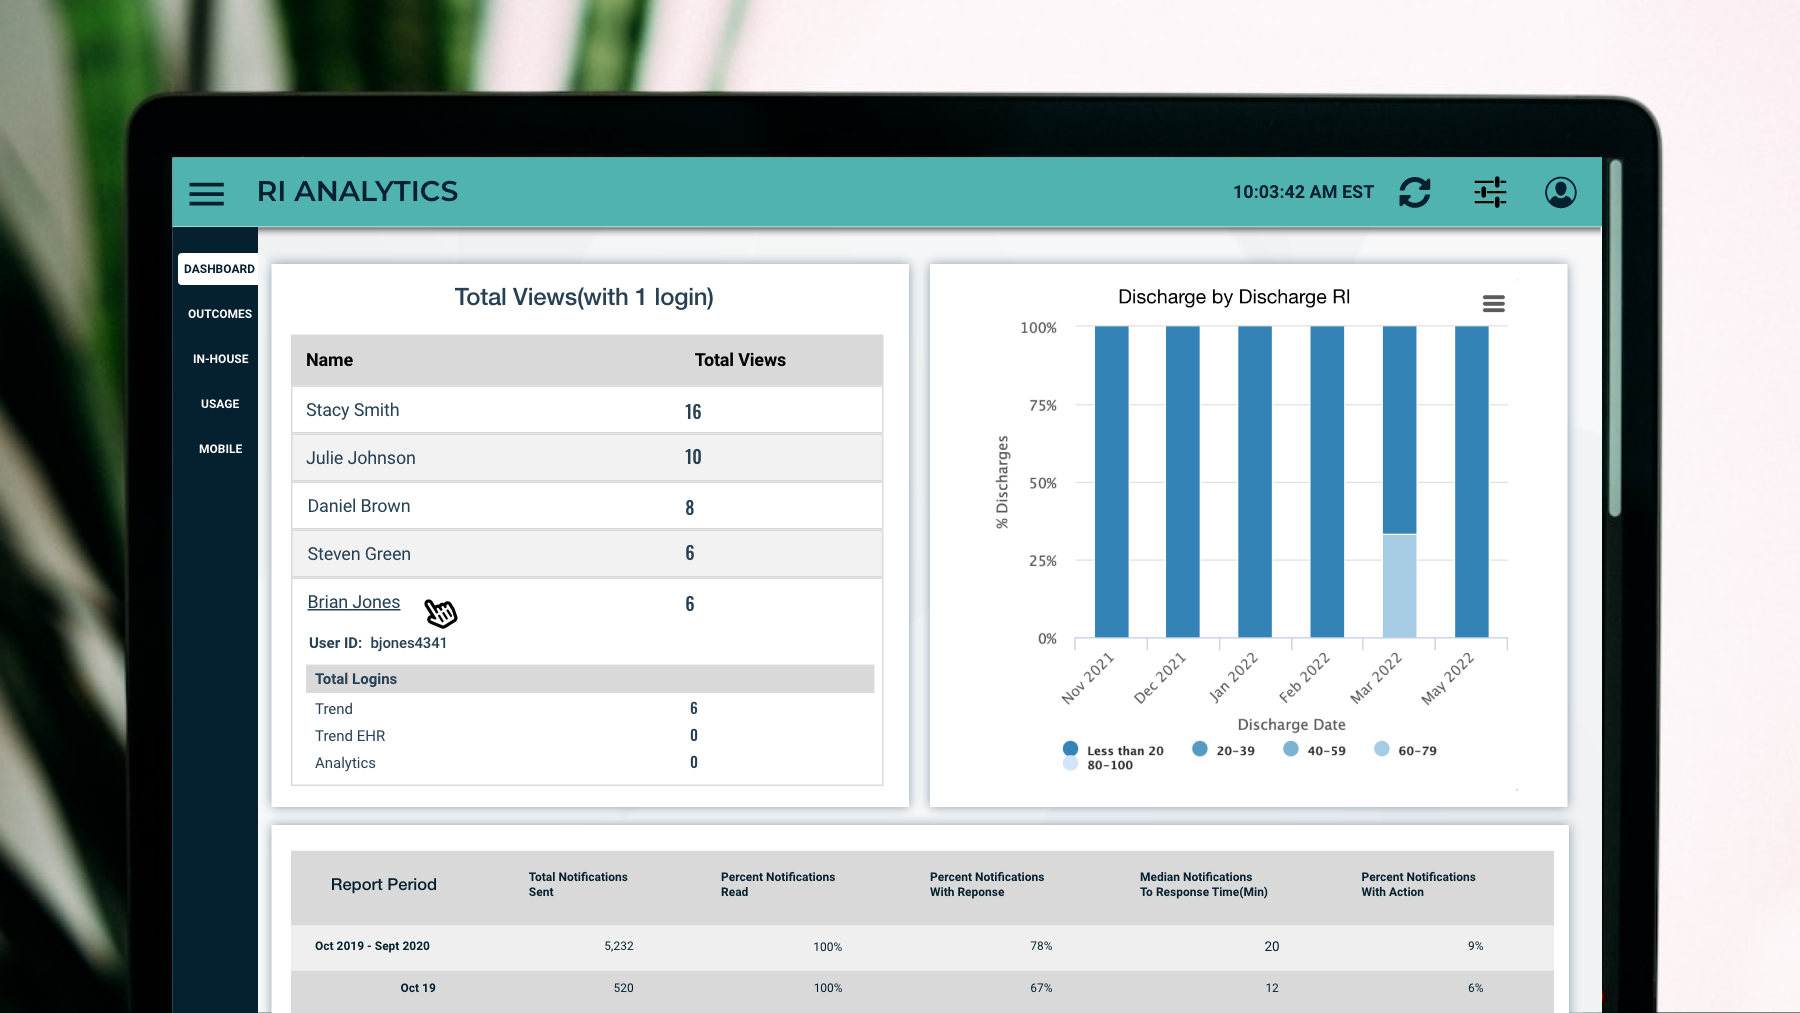
Rothman Index Analytics Dashboard
Enterprise reporting tool for hospital administrators and quality teams
The Problem
Hospital administrators and quality teams needed a way to analyze patient acuity trends across units, track Rothman Index adoption metrics, and generate reports for leadership. The existing data was locked in clinical views designed for bedside nurses not for the aggregate, trend-based analysis that administrators needed.
Constraints
- Large data volumes. Some hospitals with 500+ beds generating thousands of data points daily
- Users range from tech savvy analysts to non-technical quality directors
- Must integrate with existing PeraHealth data infrastructure (no separate data pipeline)
- Reports needed for board presentations — export to PDF/CSV required
- HIPAA compliance for all patient-level data views
Research
Methods
- Collaborated with PMs around 8 hospital quality directors and CMOs about reporting needs
- Analyzed existing ad-hoc Excel reports hospitals were building manually
- Define core metrics around existing product and workflows.
- Aligned and styled with existing Rothman Index products so that there was a defined visual between the suite.
Key Insights
- Administrators needed unit level, hospital level and individual patients level aggregations
- Time-series trends (7-day, 30-day, 90-day) were the most requested views
- Existing users spent 2+ hours/week manually building Excel reports from raw exports
- Non-technical users needed guided report templates, not blank-canvas dashboards
Process
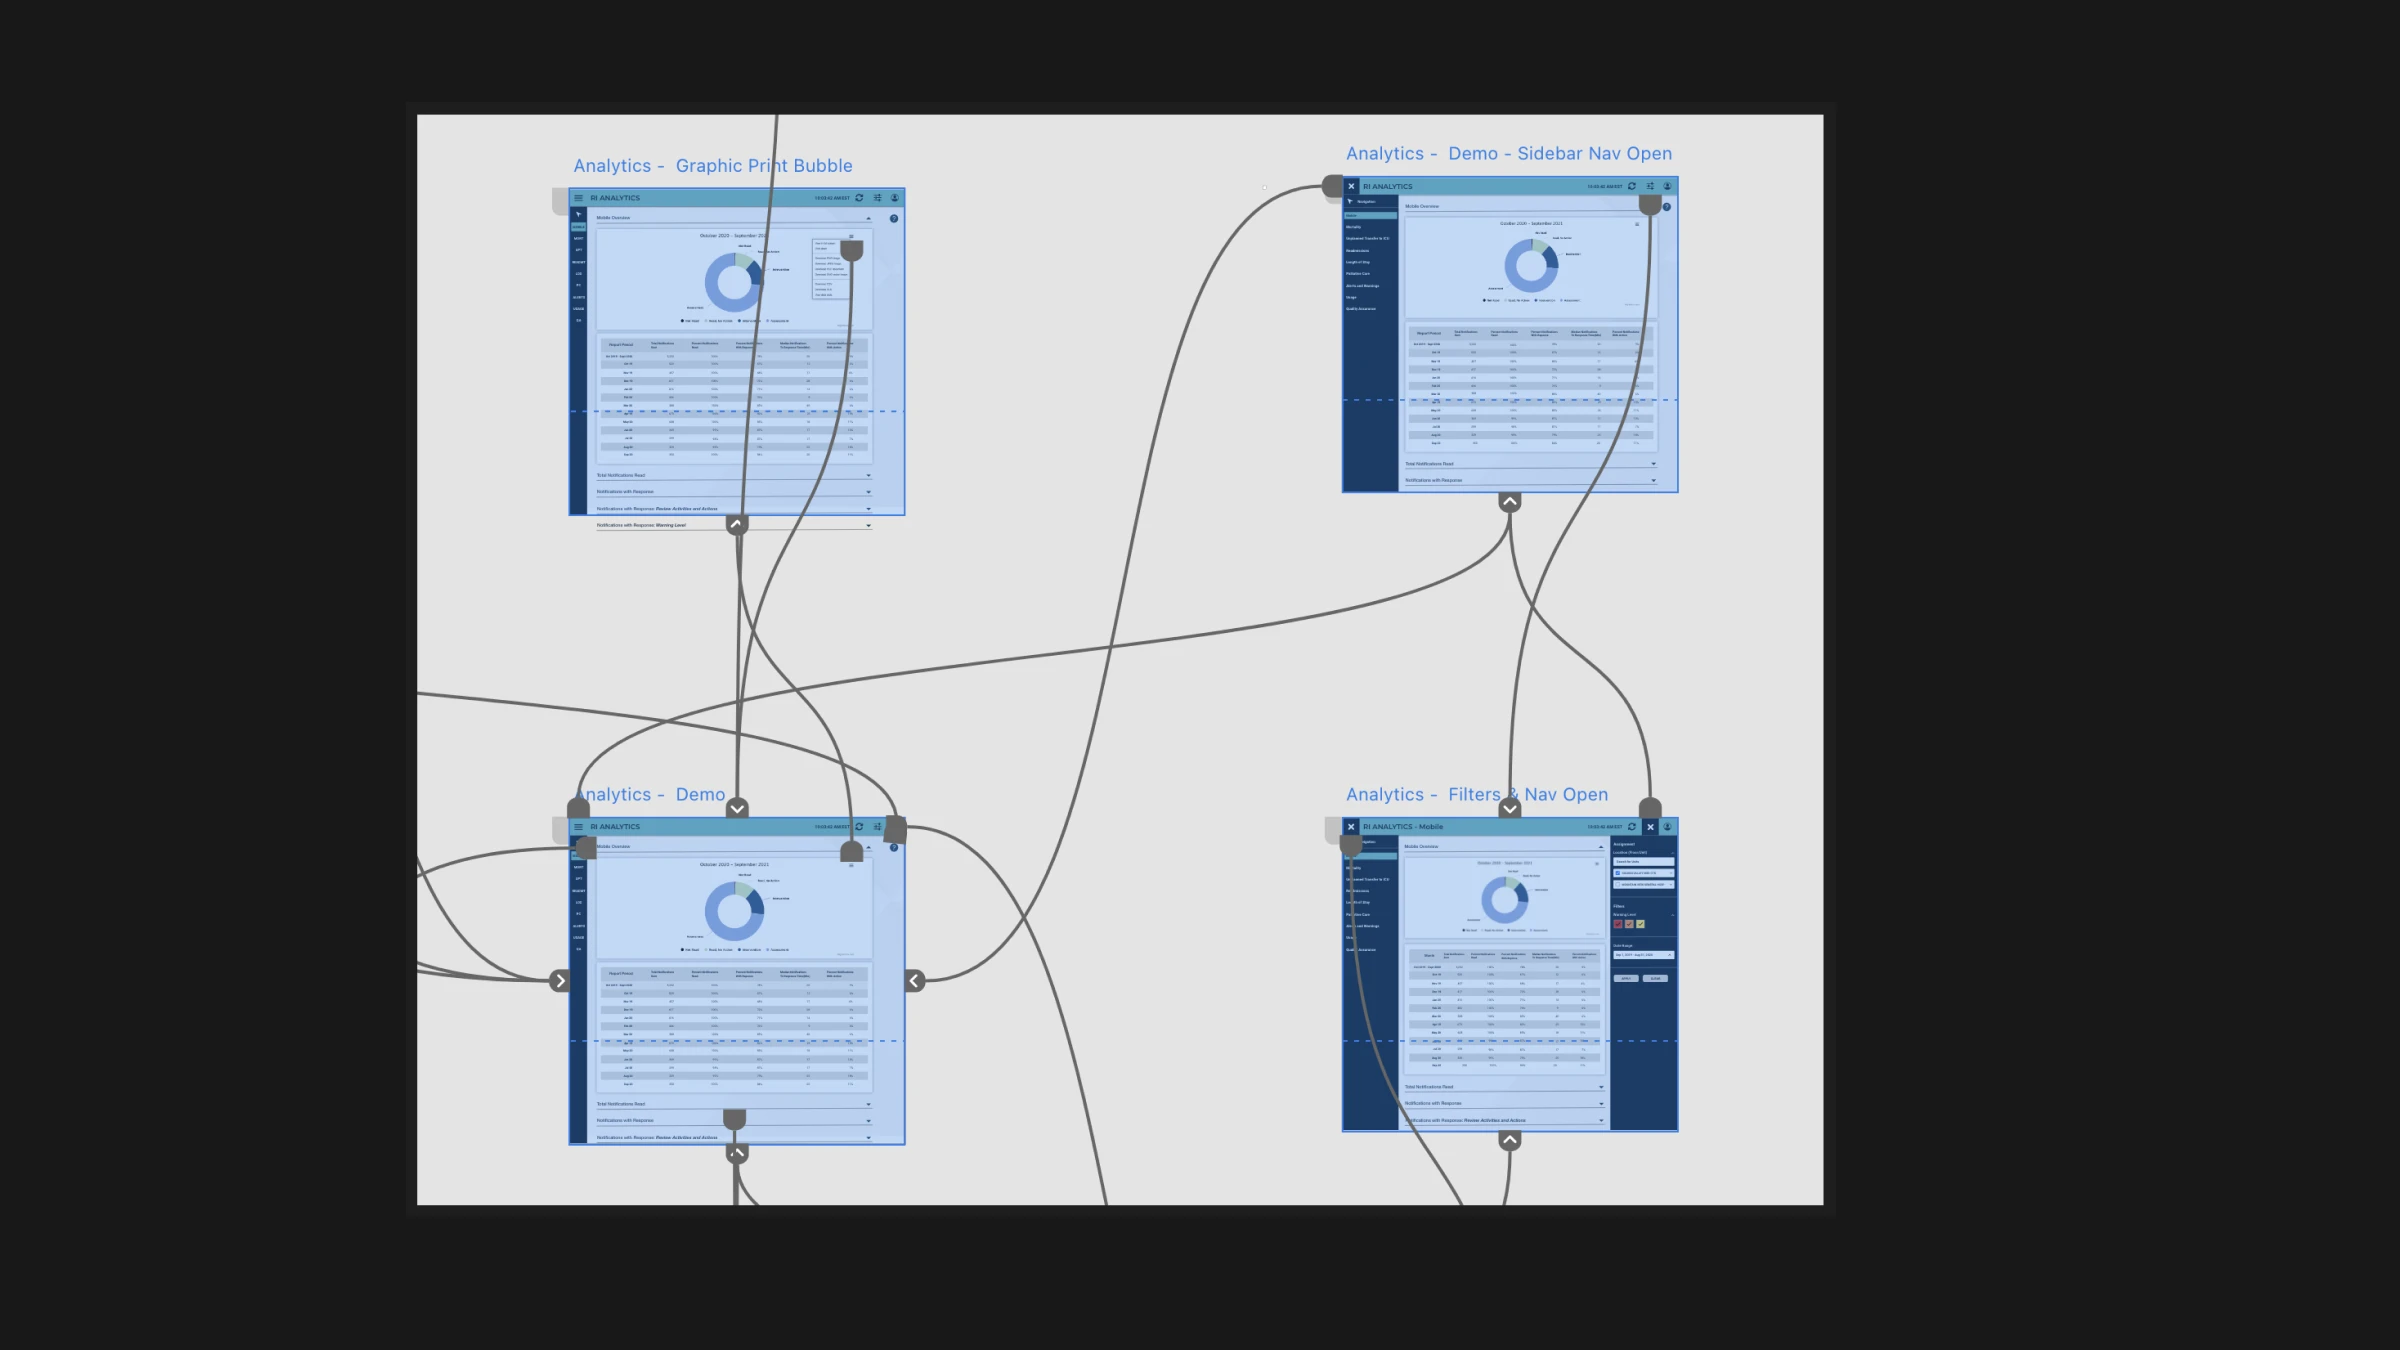
User Flows


Wireframes
Iterations
Final Design
Key Screens
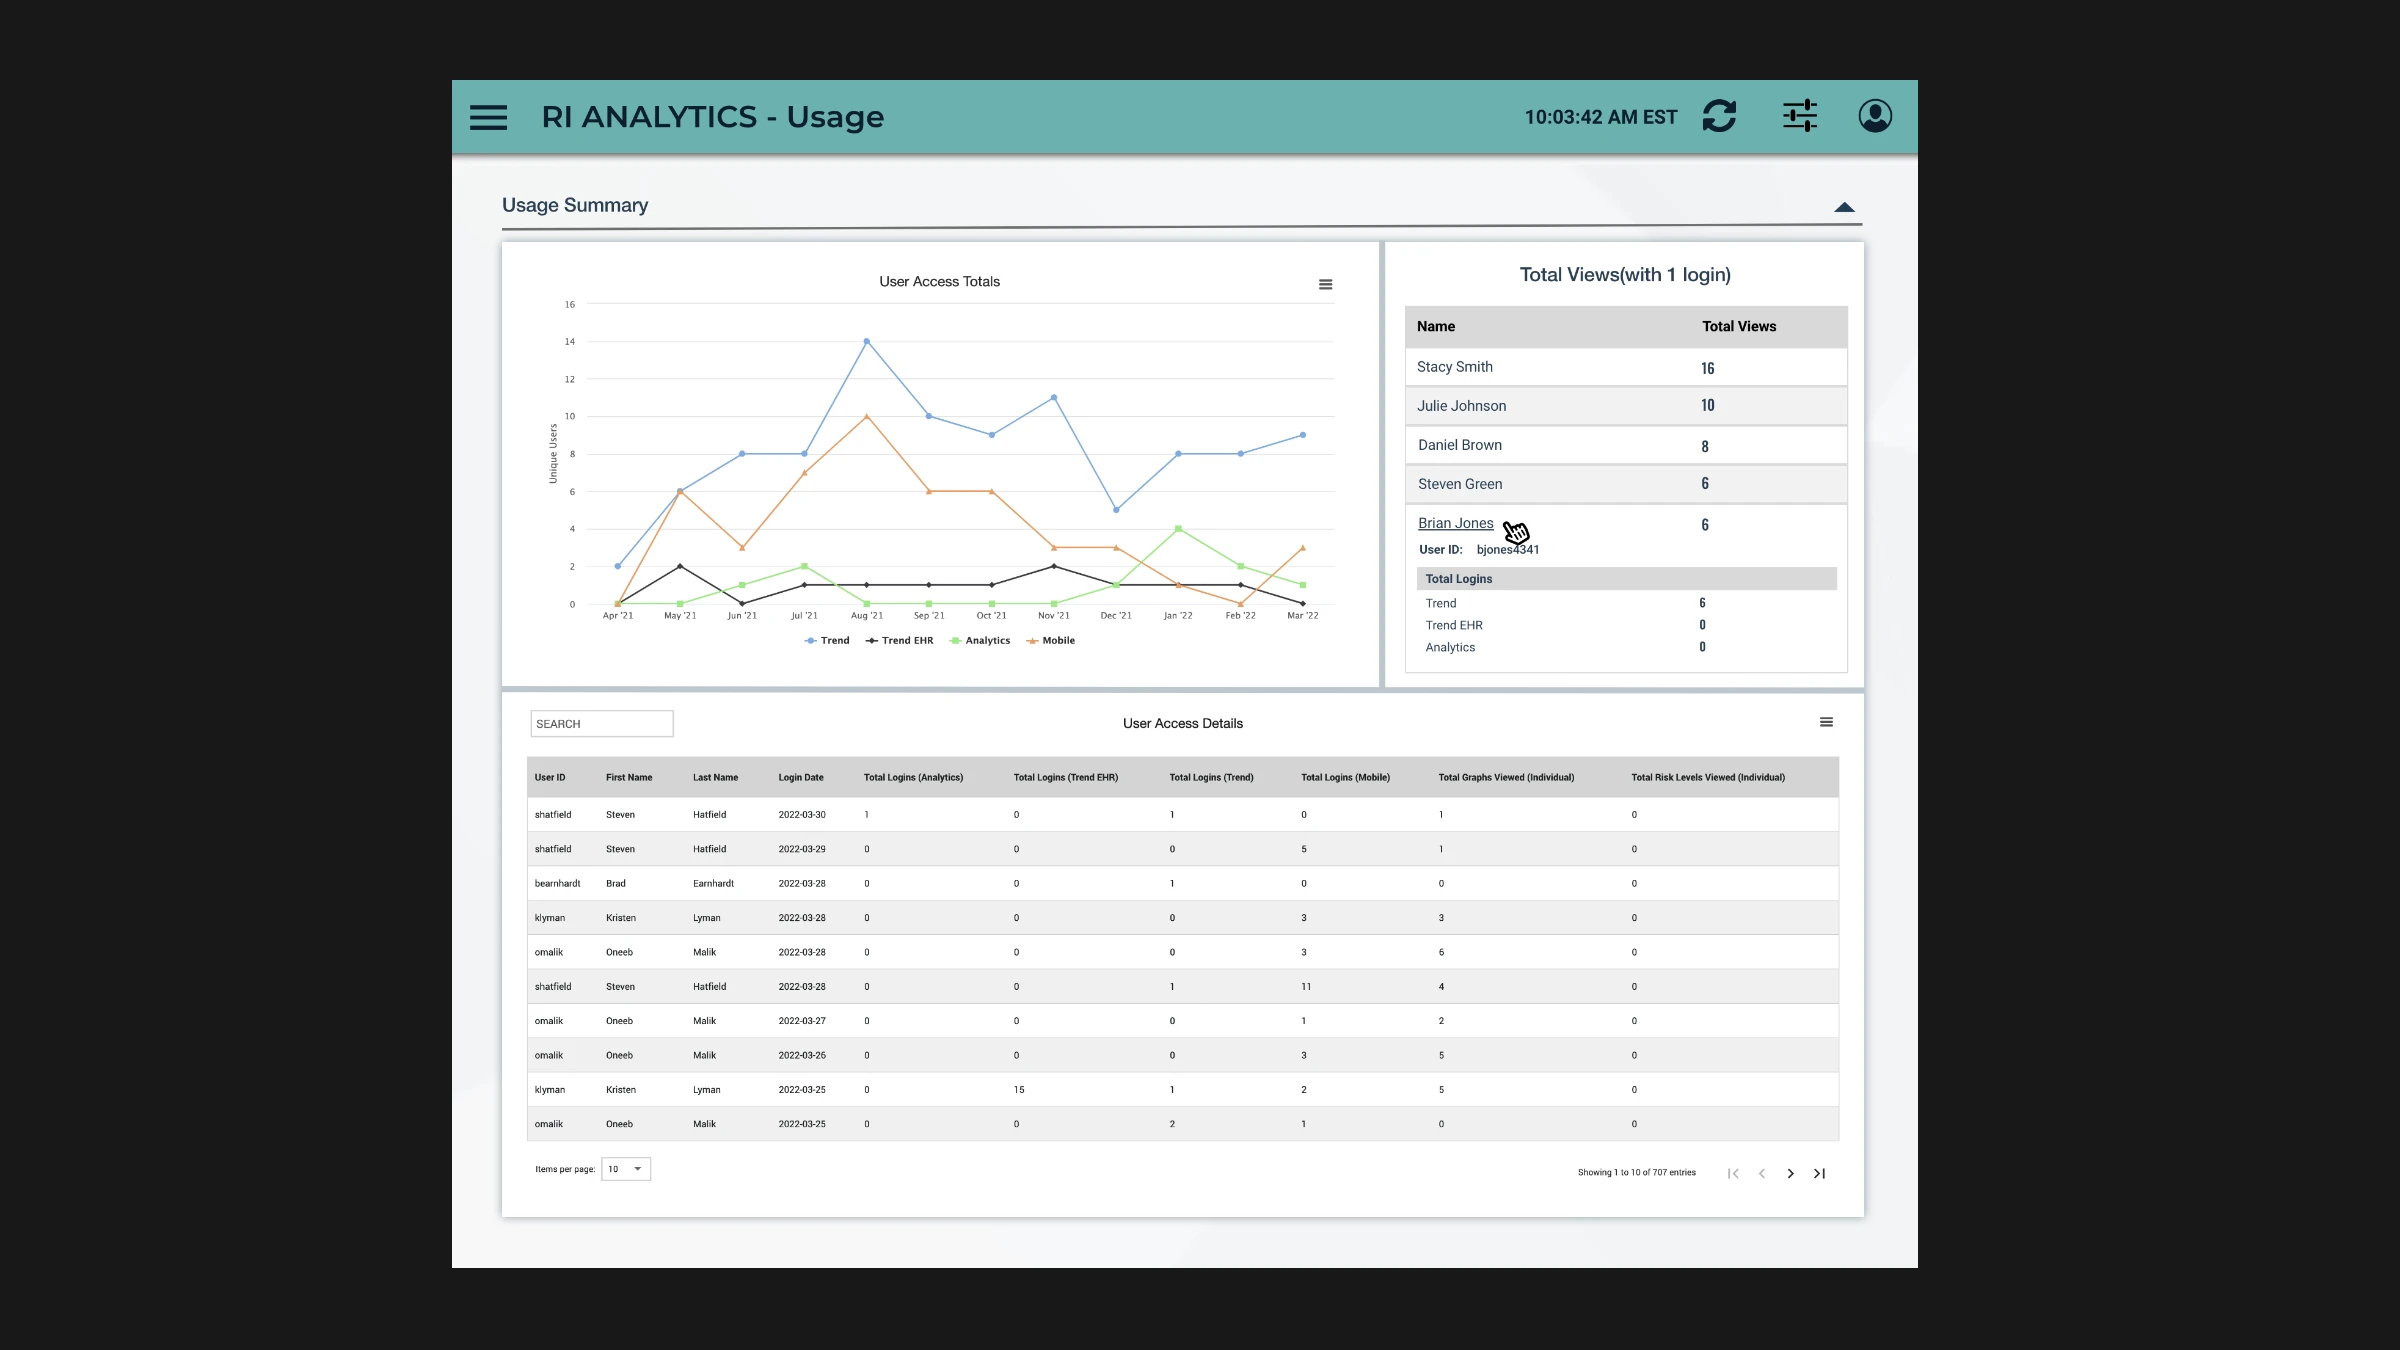
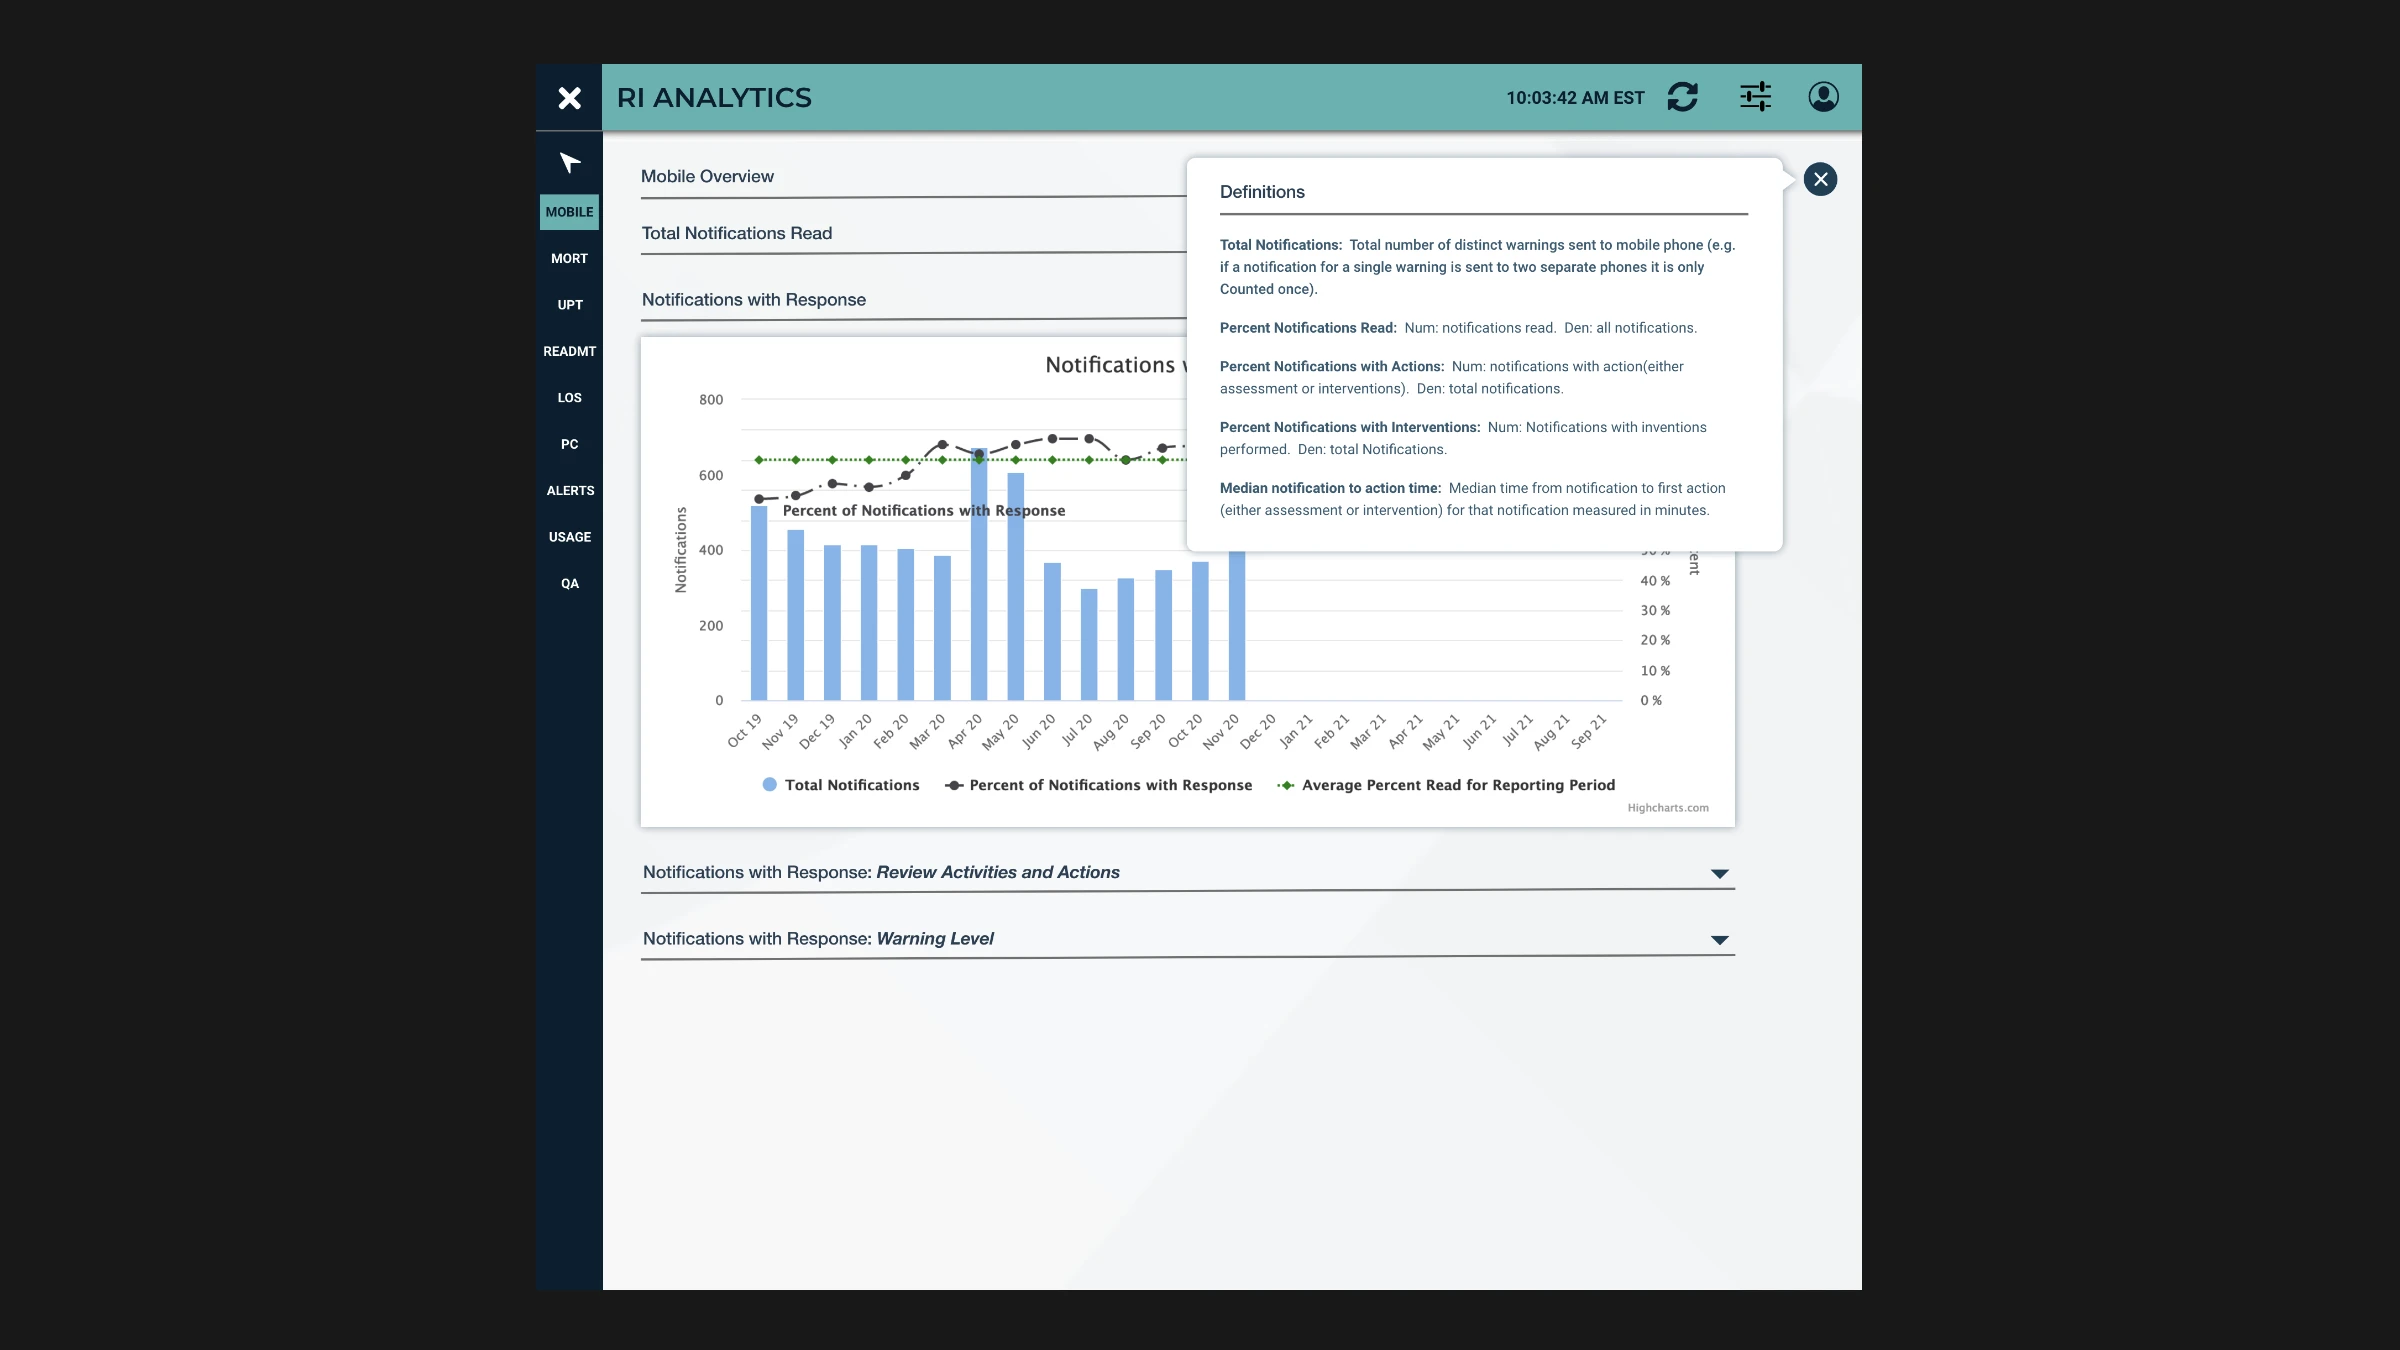
Design System
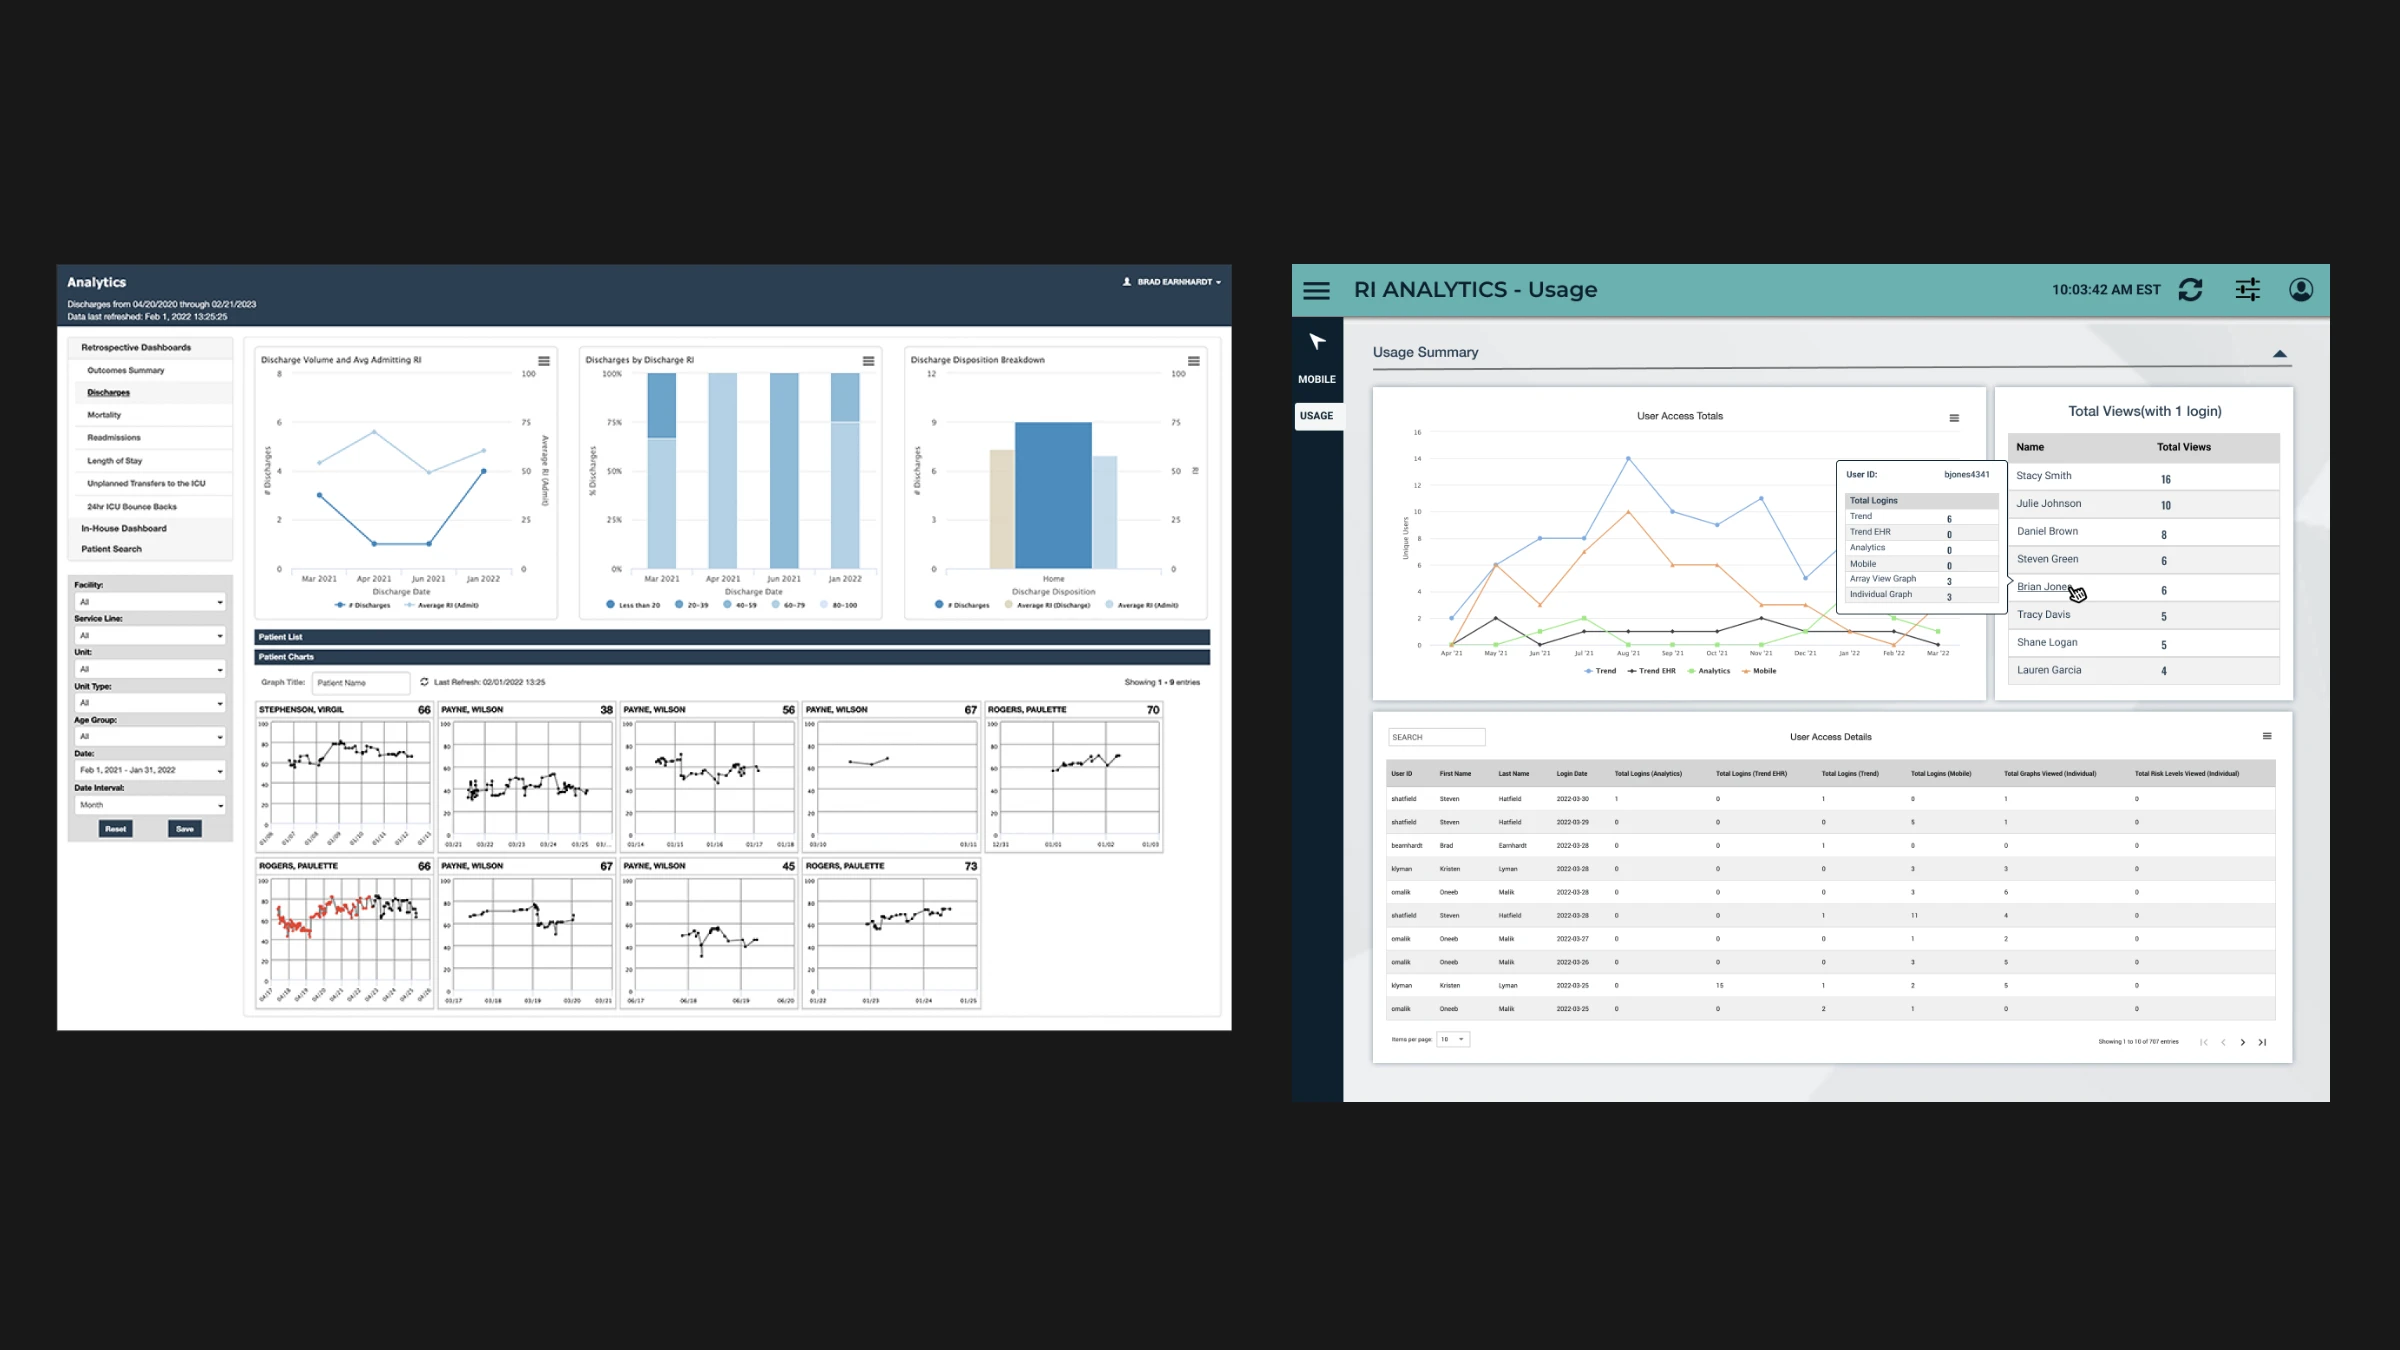
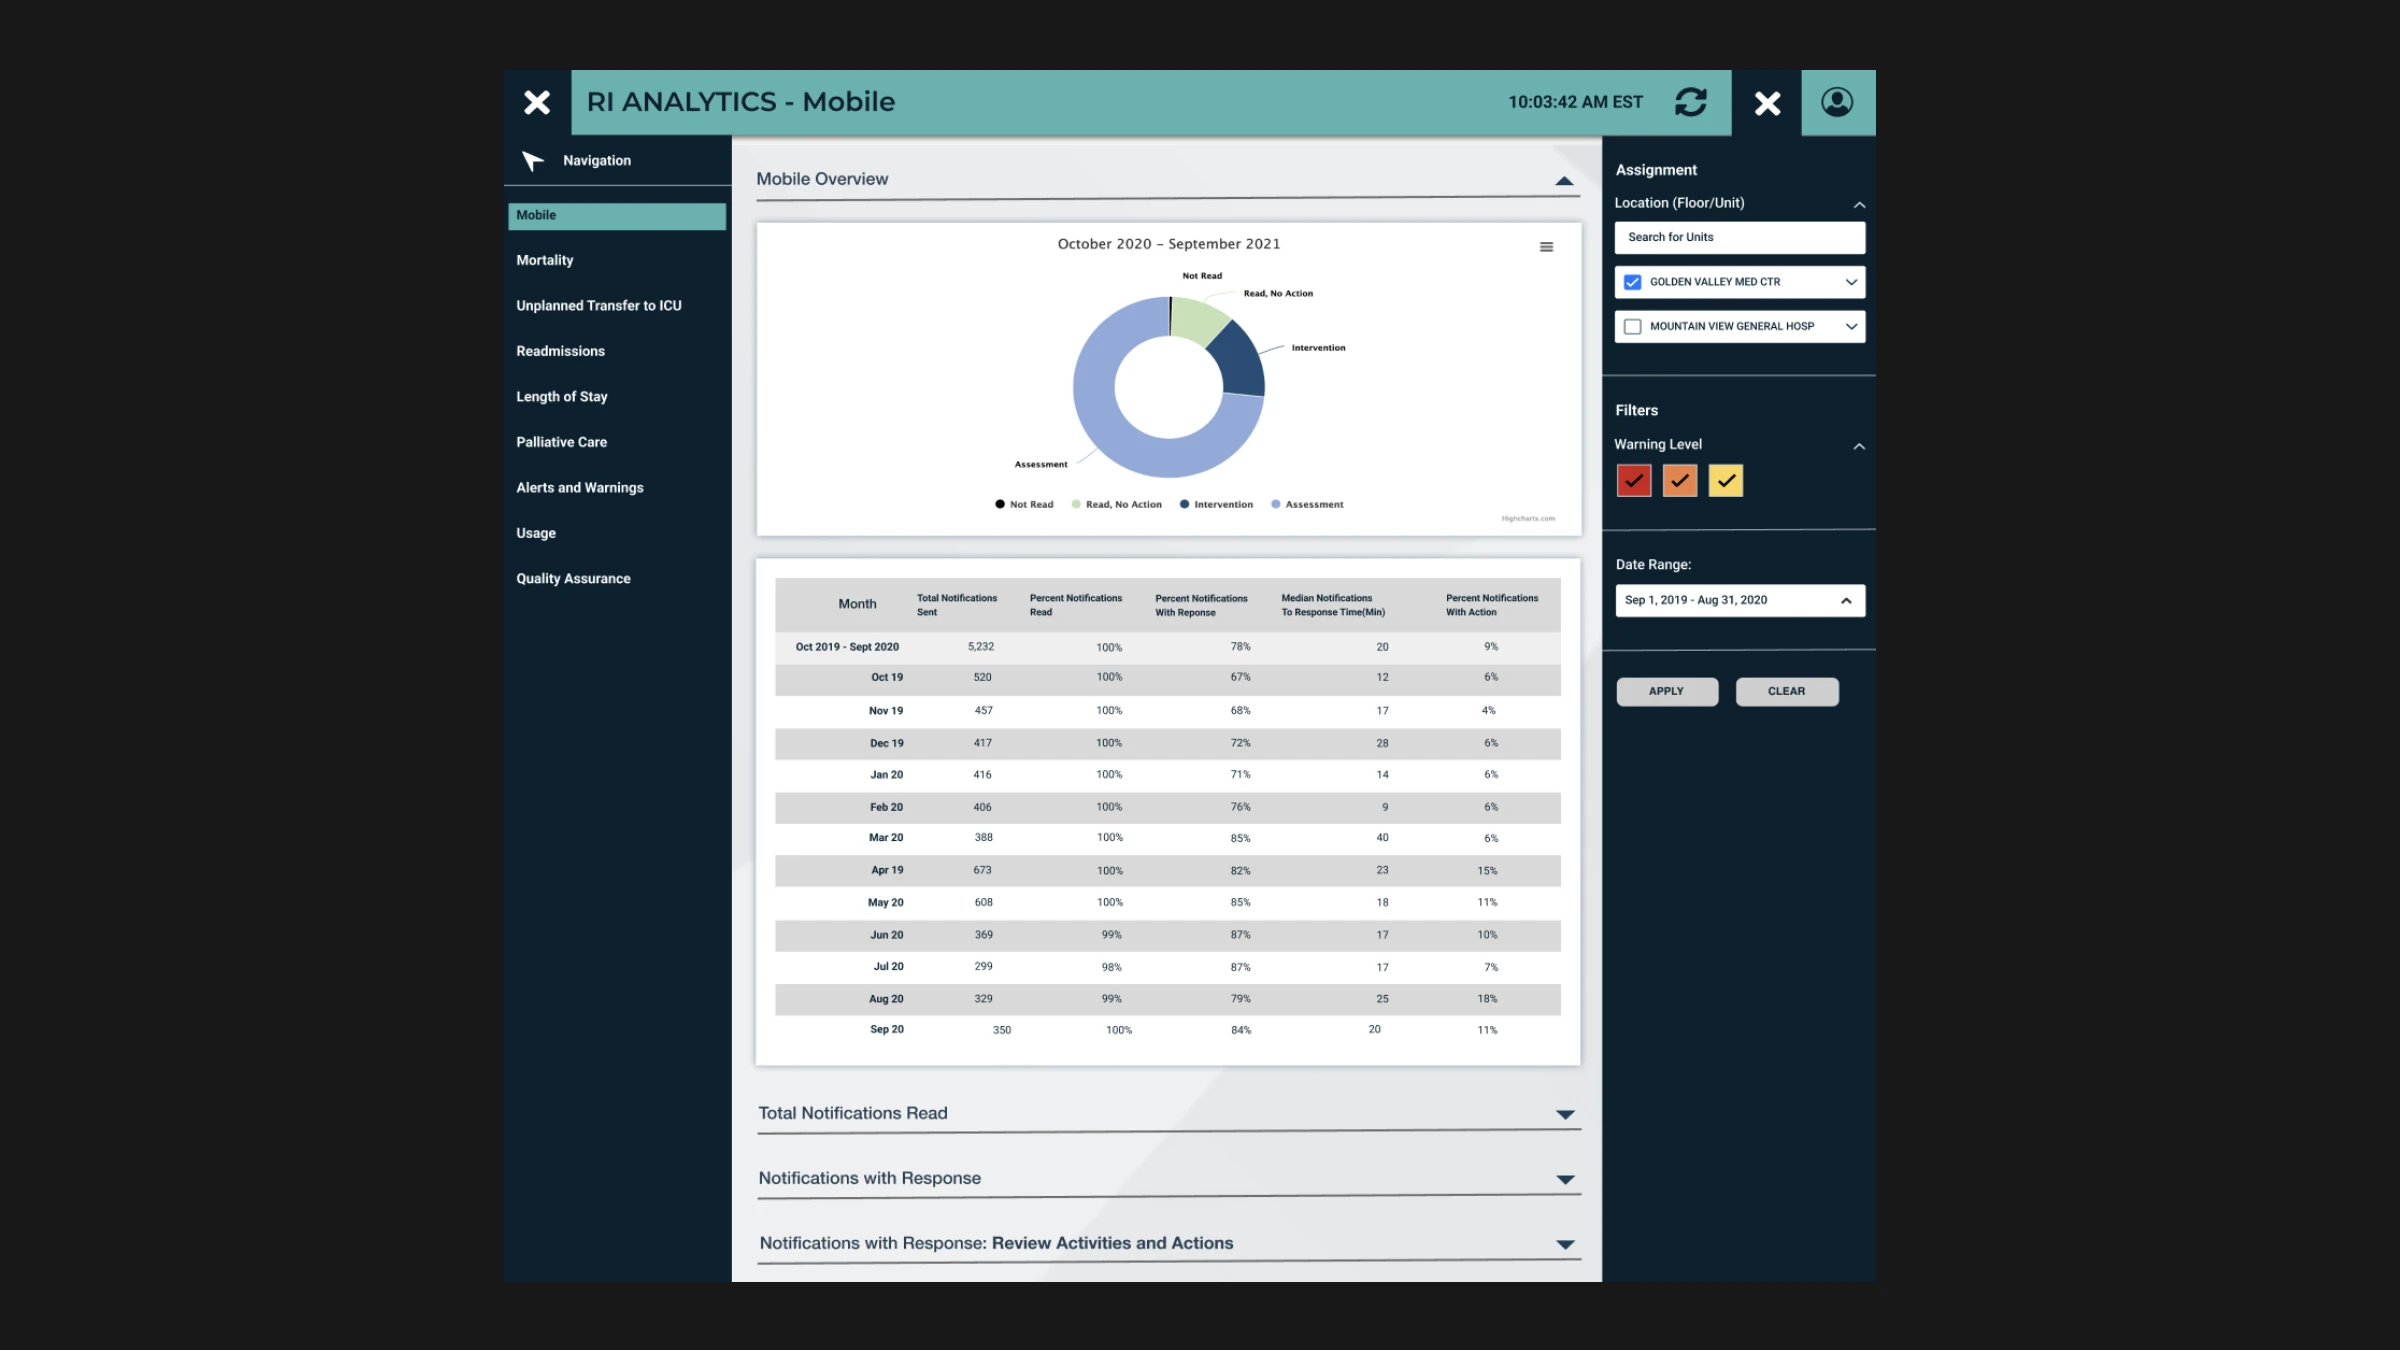
Dashboard components built on the shared PeraHealth design system. Chart components (trend lines, bar charts, heatmaps) created as reusable AdobeXD style components with Highcharts.js aligned specifications.
Collaboration
Product Manager — feature prioritization and customer feedback triage
Data engineering team — API design and query performance optimization
Front-end engineers — Angular component architecture, Highcharts.js, and Material design integration
Customer success — gathering feedback from pilot hospital deployments
Delivered interactive AdobeXD prototype for stakeholder demos, followed by component-level specs with responsive breakpoints, data state annotations (loading, empty, error), and chart interaction details. Developed HTML/CSS code base to refined exact executions of product visuals.
Outcome
- Eliminated 2+ hours/week of manual Excel reporting for quality teams
- Adopted by existing Rothman Index client hospitals within the first two months of launch(cloud based deployment)
- Reduced time-to-insight for unit-level trends from hours to seconds
- Positive feedback from hospital administrators and data analytics team on single platform reporting and simplicity of report generation
"This dashboard finally gives us the visibility and report exporting we needed without having to ask support for a custom report every time."